50 points
The purpose of a quantitative research project is to conduct an analysis, report the results, and interpret the results. Reporting the results requires one to summarize the conduct of the analysis, present the statistical outcome, and describe the hypothesis test. The following guidance is provided for reporting the results of a statistical analysis.
Note: Prior to using these instructions, one must install the PROCESS macro in SPSS. Please see my prior post, Installing PROCESS Macro in SPSS for guidance in this installation.

The conduct of the analysis. Introducing the results begins with a statement of the analysis that was conducted, including naming the variables and the relationship between those variables.
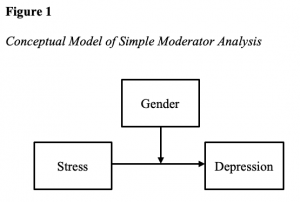
A simple moderator analysis using Hayes (2018) model 1 was completed using the variables gender, a dichotomous (categorical) variable with two groups of male and female, as the moderator (W), Stress, as measured by DASS-Stress, a continuous-interval level of measurement variable, as the predictor (X) and Depression, as measured by DASS-Depression, a continuous-interval level of measurement variable, as the criterion (Y) from the EDCO 745 course dataset. The relationships examined are presented in Figure 1.

Note how in the example the variables are listed as are the roles of each variable in the study. Following this introduction, one should describe the preparation of the data and describe if the data are suitable for statistical analysis. Any violations of assumptions for the selected statistical test should be presented, along with how the violation was handled.
The data were screened and tests of assumptions for multiple regression were completed, as demonstrated in the Week 6 assignment, Regression Data: Screening Output Assignment. Although there was a minor deviation from normality for the residuals, the data were not transformed. Violation of the normality of residuals does not lead to issues with significance testing, particularly with larger sample sizes, and does not suggest any discrepancies with model coefficients should be anticipated. Instead, this violation may be an indication that a better regression model may be needed (Cohen et al., 2003). The tests of assumptions demonstrated the data are suitable for conducting the moderator analysis.
Present the statistical outcome. The next task is to present the results of the statistical analysis and support for the analysis. Although the format for presenting statistics varies by the statistical test, all results should present the sample size or degrees of freedom, the test statistic, the p-value, and the effect size. In some studies, confidence intervals may be presented. One should also present the tabular output (i.e., SPSS tables) demonstrating the results.
A moderator analysis using PROCESS (v.4.0; Hayes, 2018) was conducted to test the null hypothesis. There was a significant predictive effect between Stress and Depression, t = 19.9224, p < .001, b = 0.9353. The result of the interaction effect between gender and Stress upon Depression was not statistically significant, t = -0.8145, p = .4155, b = -0.0251. See Tables 1 and 2.


Describe the hypothesis test. The overall goal of research is to conduct and report on the hypothesis test answer the research question and address the research problem. To complete the reporting of results, one must report on the outcome of the hypothesis test. There are only two outcomes for a hypothesis test. The first is the results fail to reject the null hypothesis, described by the expression p ≥ 𝛼, where 𝛼 is the level of significance, which is usually established at .05, and p is the probability of the sample representing a true null hypothesis. The first alternative means there was not enough evidence in the sample data to demonstrate the null hypothesis statement was incorrect. The second possible outcome is the results reject the null hypothesis, described by the expression p < 𝛼. When the results reject the null hypothesis, the alternative hypothesis is used to answer the research question.
The remainder of describing the hypothesis test is to provide a summary of the outcome in terms of the research question. A word of caution: This is not an opportunity to begin interpreting the results in relation to the literature or theoretical framework. The synopsis should present enough information such that the reader can understand the meaning of the statistical results.
The results failed to reject the null hypotheses, which stated that gender does not significantly moderate the predictive effect between Stress (X) and Depression (Y). The results suggest that although there is a significant predictive effect between Stress and Depression, the extent of the effect between Stress and Depression is not dependent upon one’s gender.
Presenting the results of hypothesis testing is a critical skill in research. The results represent the outcome of months, if not years, of hard work and provide the impetus for developing further implications and recommendations. To be effective in presenting these discussions, one must clearly articulate the results so the reader may understand the relationships between the variables, if any, and the magnitude of the effect. A well-written set of results is direct and succinct, presenting the results in an objective and academic manner.

Submitting the assignment
When submitting this assignment, you must first describe the assignment. The write-up should be descriptive of the variables and the activities used to screen the data, along with a description of the results, as described above. All submissions must be a single Microsoft Word document. Do not submit the SPSS file.
References
Cohen, J., Cohen, P., West, S. G., & Aiken, L. S. (2003). Applied multiple regression/correlation analysis for the behavioral sciences (3rd ed.). Routledge.
Hayes, A. F. (2018). An introduction to mediation, moderation, and conditional process analysis: a regression-based approach (2nd ed.). Guilford Press.

